|
|
|
|
|
||||||||||||||||||||||||
| FAQ | Finance glossary | Basic statistics | Monte Carlo simulation | Risk & CAPM | Lease or buy |
| Tutorial: M O N T E C A R L O S I M U L A T I O N |
|||||||
|
Every financial analysis requiring to project future outcomes contains some level of uncertainty. Unless you have a good crystal ball,
these projections will seldom turn out to be exactly as forecasted. Monte Carlo simulation is a technique that helps you to model
uncertainties behind these projections. The simulation is a sophisticated scenario analysis that can model thousands of scenarios in seconds.
Instead of relying on one set of projections, you can simulate a range of possible outcomes to gain better understanding about the likelihood of success.
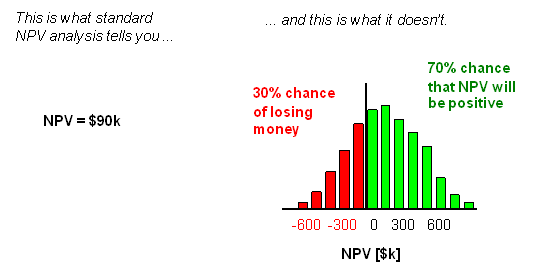
In the case of the ROI analysis with Monte Carlo simulation, for example, rather than providing a single return on investment figure, like the standard net present value (NPV) analysis shown on the left below, the Monte Carlo simulation returns a range of possible outcomes (shown on the right), together with the probability of their occurrences. In this example, Monte Carlo simulation allows you to determine not just whether an investment will be profitable, but how likely it is to be profitable and how profitable it is likely to be. The chart below reveals that there is a 70% chance that this particular investment will make money. But there is also a 30% chance that it will be a loss. |
|||||||
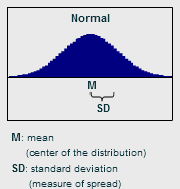
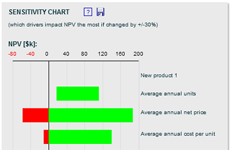
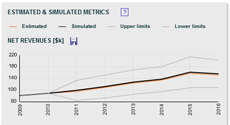
Simulation and results visualization Monte Carlo simulation uses the selected distributions and their simulation parameters to automatically generate thousands of scenarios (or iterations), usually in just few seconds. At each iteration, the simulation selects a random value for each identified variable based on the defined parameters and calculates the corresponding outcome. After all iterations, the results can be visualized, but the visualization will depend on the type of analysis. In the ROI analysis for example, the range (or probability distribution) of NPV is depicted. On the cash flow forecast, on the other hand, the simulation outcomes are translated into a range of possible cash flows over time. If the simulation results are visualized through a probability distribution, the resulting probability distribution may resemble a normal distribution even if other distribution types were selected to model the input variables. This is due to the fact that many real life situations can be described with a normal distribution if the sample size is large enough. Since the Monte Carlo simulation analyzes thousands of scenarios, i.e., thousands of samples, the resulting probability distribution may resemble a normal distribution. This fact is described through a mathematical theorem, known as the central limit theorem. Although Monte Carlo simulation can be run for all input variables, it is recommended to focus the simulation on the key drivers of the analyzed metric. This can simplify the analysis and helps to better understand the results. To identify the key drivers, a sensitivity chart can be used. This chart identifies the most relevant drivers that have the highest impact on the results. The sensitivity chart is also referred to as Tornado chart due to its shape used in some applications. The Monte Carlo simulation used in FinanceIsland's tools assumes that the input variables are relatively independent of each other. If this is not the case or if some inputs are mutually exclusive, a Monte Carlo simulation customized for the specific analysis may be more appropriate to use. Beware of Black Swans One aspect to keep in mind when running any scenario analysis, including Monte Carlo simulation, is that the analysis is only accurate for scenarios not wildly different than the most likely estimates. There may be, however, extraordinary, though not absolutely unlikely events, where one or more variables are significantly different from the one modeled, which would dramatically impact the results. In the case of the ROI analysis, for example, the number of units sold could be hundred times higher than forecasted if the new product exceeds any possible expectations. Or the product may not sell at all if the economy crashes and customers stop buying these types of products. Events like these, referred to also as Black Swans, have a low likelihood of occurrence, but big impact. Since Black Swans are unexpected by definition, they are not modeled in financial analyses. These events would also not fit the cost structures and interdependencies defined in financial models. Bottom line Although Monte Carlo simulation will not eliminate uncertainties in business decisions, it can help you to understand them in normal business circumstances. It can be especially helpful in financial projections for projects that are not based on repeated past experiences. These projections are most often badly flawed. If there is a chance of negative financial outcome in your business, Monte Carlo simulation will allow you to identify its main drivers. Similarly, if you're allocating resources among several projects, Monte Carlo simulation will help you to determine which ones have the greatest chance of success. With the modeling capabilities of Monte Carlo simulation you can make better financial decisions. You can see Monte Carlo simulation in action when using FinanceIsland's financial analysis tools. |
|||||||
|
|||||||